Valid for Sitecore
5.3
Using the Debugger
By default, the Debugger starts by debugging the root of the website site.
The Sitecore Debugger window consists of the Page Output, followed by the Profile section, followed by the Trace section.
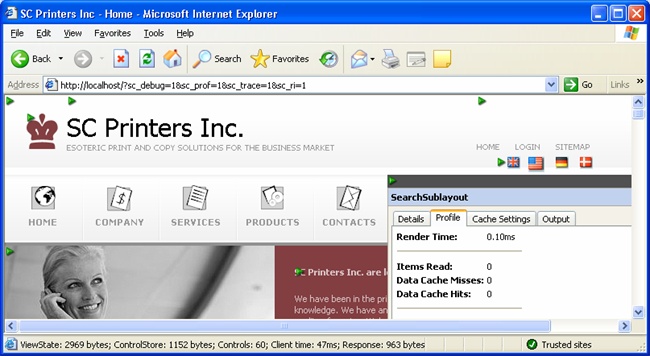
A fly-out menu is available by moving the mouse pointer to the right edge of the page.
This section contains the rendered output of a specific page with the Info Markers in the upper-left corner of each rendering on page.
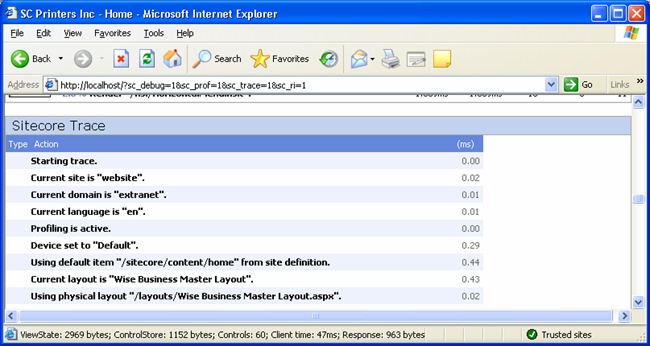
Sitecore Trace contains the detailed information about the actions performed during the page rendering.
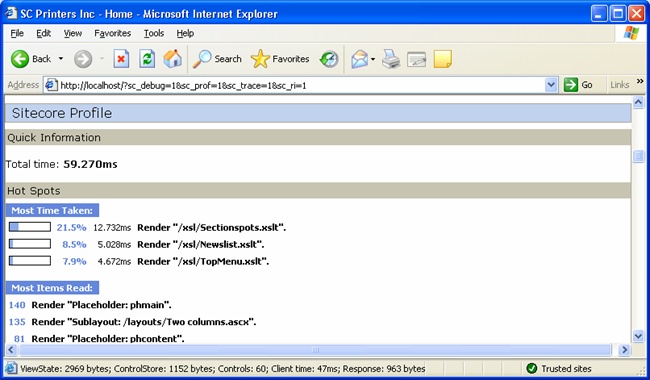
Sitecore Profile window provides the trace summary along with the cache usage information.